by David Menoyo
Share
by David Menoyo

In data science, understanding and summarizing data is a foundational step. Because they help identify a representative value within a dataset, measures of central tendency are crucial in this respect and form a central element of descriptive statistics. Descriptive statistics provide a way to describe and summarize the main features of a dataset, offering a clear picture of its overall structure.
Measures of central tendency are essential for summarizing data, but they are only part of the story. To fully characterize and understand the data, it is equally important to consider measures of variability, which describe the spread or dispersion within the dataset. In this post, we will briefly describe the main measures of central tendency, explaining their definitions, use cases, and advantages. In a subsequent post, we will explore measures of variability, completing our overview of key descriptive statistics.
By comprehending both central tendency and variability, one can gain a more comprehensive understanding of the dataset, making it easier to draw meaningful insights and make informed decisions.
Importance of Choosing the Right Metric
Different metrics of central tendency are suitable for different types of data. The choice of metric depends on factors like the distribution of the data, the presence of outliers, and the inherent characteristics of the data itself. Each metric may perform differently depending on whether the data is skewed, has outliers, follows a specific distribution pattern, or exhibits unique characteristics. Choosing the appropriate measure can provide a clearer and more accurate representation of the data, ensuring that insights drawn are meaningful and reliable.
However, relying solely on central tendency metrics often does not provide a complete picture of the dataset. To fully understand the data, it’s essential to complement these measures with measures of variability. Measures of variability allow us to grasp how the data points are dispersed or spread around the central tendency, providing additional context and depth to our analysis.
In this post, we will discuss the main measures of central tendency and explore their characteristics. By understanding these metrics and their roles in summarizing data, we can better appreciate their strengths and limitations in different data scenarios.
Main Measures of Central Tendency
The main measures of central tendency include the mode, median, arithmetic mean, geometric mean, and harmonic mean. Each of these measures has its unique properties and are suitable for different types of data. Below, we will explore each of these measures in detail, discussing their definitions, use cases, advantages and disadvantages.
Arithmetic Mean
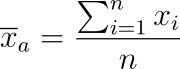
- Definition: The arithmetic mean is the sum of all values divided by the number of values.
- Use Cases: It works well for symmetric distributions without extreme outliers.
- Pros and Cons: The arithmetic mean is simple to compute and understand. However, it can be heavily influenced by outliers and skewed data.
Geometric Mean
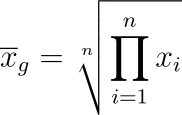
- Definition: The geometric mean is the nth root of the product of n values.
- Use Cases: It is suitable for data that is multiplicative or has a log-normal distribution.
- Pros and Cons: The geometric mean handles skewed data better than the arithmetic mean, but it cannot handle negative or zero values.
Harmonic Mean
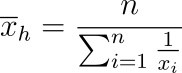
- Definition: The harmonic mean is the reciprocal of the arithmetic mean of the reciprocals of the data values.
- Use Cases: It is best for rates and ratios, such as speeds or densities.
- Pros and Cons: The harmonic mean is sensitive to low values and cannot handle zeros. It is useful in specific scenarios like average rates.
Median
- Definition: The median is the middle value when the data is ordered from least to greatest.
- Use Cases: It is ideal for skewed distributions, as it is not affected by outliers.
- Pros and Cons: The median is robust against outliers and skewed data, but it can be less informative for small datasets.
Mode
- Definition: The mode is the most frequently occurring value in a dataset.
- Use Cases: It is particularly useful for categorical data or datasets with a high frequency of particular values.
- Pros and Cons: The mode is simple to understand and calculate. However, it may not provide a clear picture for continuous data with many unique values.
Practical Examples: Choosing the Right Measure of Central Tendency
Example 1. Normal Distribution
Consider a dataset that follows a roughly Normal Distribution, often depicted as a bell-shaped density plot. In this scenario, several measures of central tendency could be appropriate, but choosing the most suitable one depends on understanding the characteristics of the distribution:
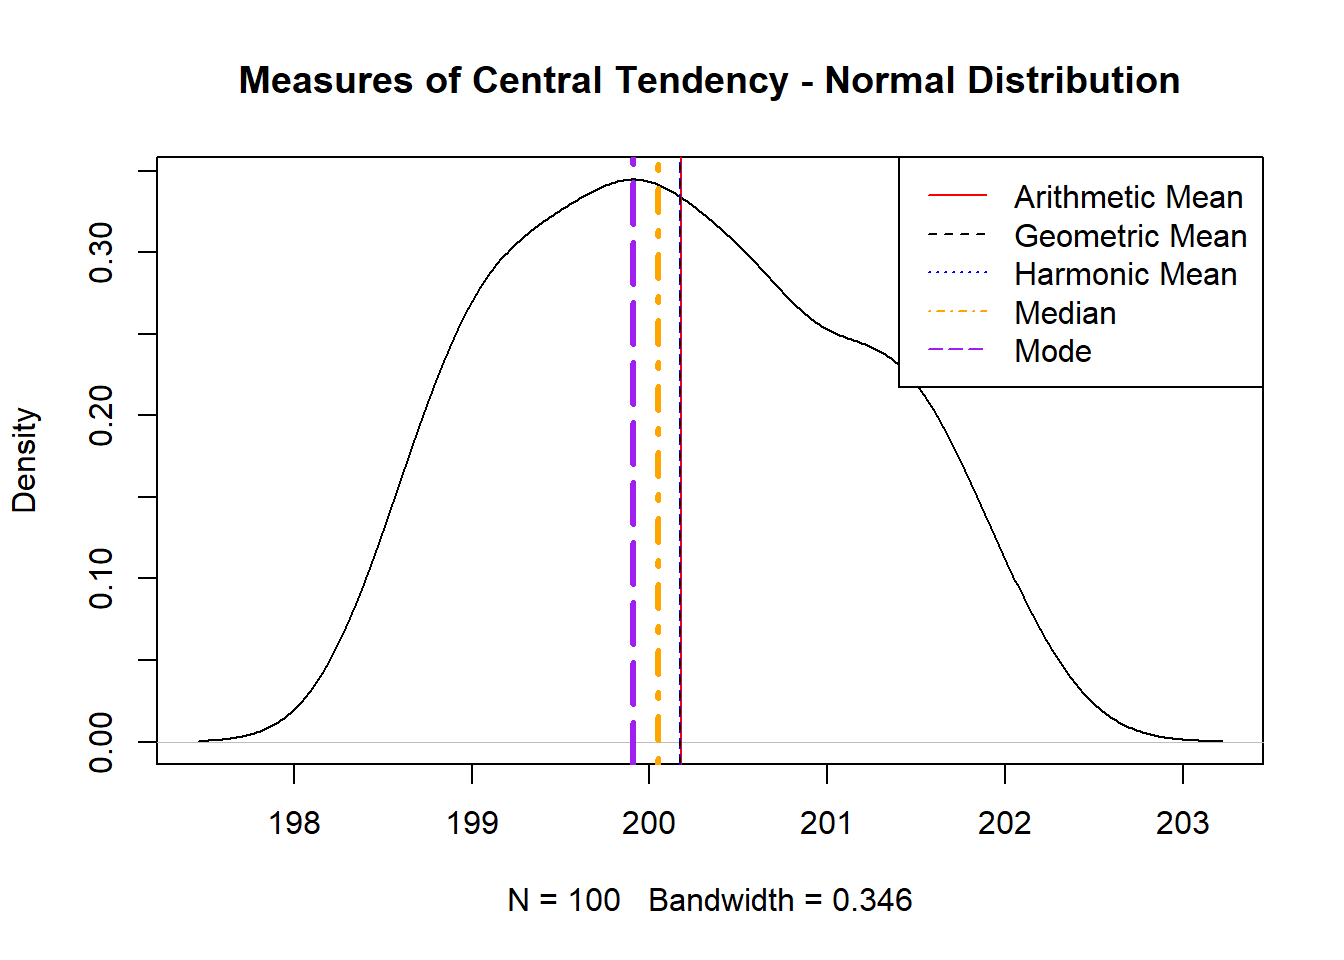
- Arithmetic Mean: For a perfectly normal distribution, the arithmetic mean is often the preferred measure. This is because it uses all data points, providing a balanced central value. In a symmetrical distribution, the mean accurately represents the dataset’s center.
- Median: While the median is less sensitive to outliers, in a normal distribution, outliers are typically less prevalent. However, if there are slight deviations from normality, the median can still provide a robust central value, unaffected by any minor skewness or outliers.
- Mode: For a unimodal normal distribution, the mode (the most frequent value) coincides with the mean and median. While the mode is useful in identifying the peak of the distribution, it offers less comprehensive information compared to the mean and median in this context.
- Geometric and Harmonic Means: These measures are not typically used for normally distributed data as they are more suited for multiplicative data, log-normal distributions, or datasets involving rates or ratios. Keep in mind that for a normal distribution with low variance and tightly clustered values, the arithmetic mean, geometric mean, and harmonic mean can return similar values. However, as variance increases or the distribution becomes skewed, the differences between these means become more pronounced. The arithmetic mean generally remains the best measure of central tendency for normally distributed data
In this case, for a dataset following a random normal distribution, the arithmetic mean is generally the best choice. It leverages all data points, offering a precise central value that aligns well with the symmetrical nature of the distribution. However, if there are concerns about outliers or slight skewness, the median serves as a strong alternative.
Example 2. Gamma Distribution
Consider a dataset that follows a gamma distribution, often used to model skewed data such as waiting times or life durations. The gamma distribution is characterized by its shape and scale parameters, which influence its skewness. Choosing the appropriate measure of central tendency for such a distribution requires understanding its unique characteristics:
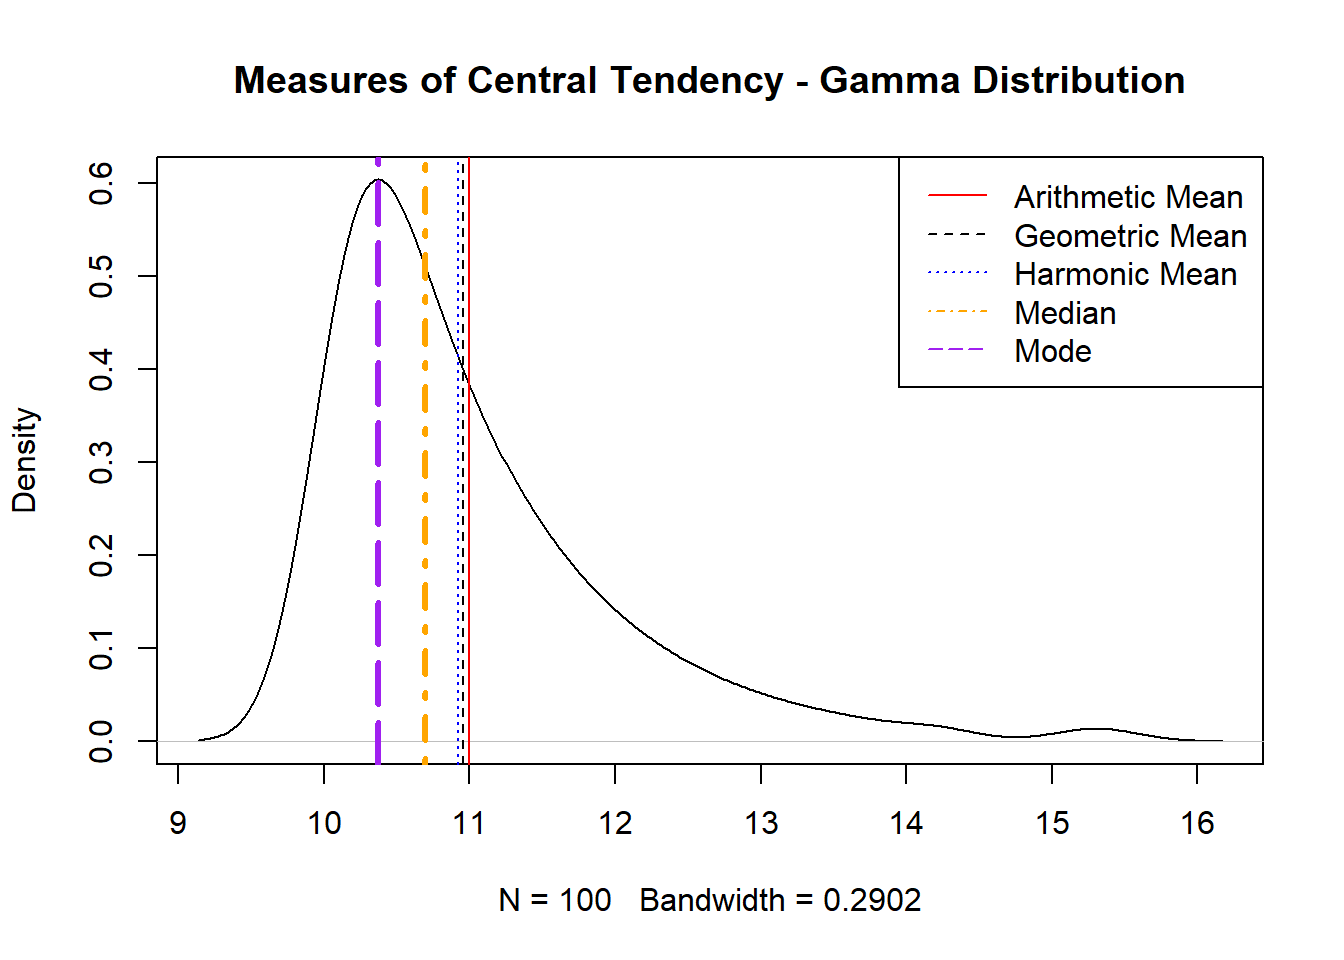
- Arithmetic Mean: The arithmetic mean is commonly used for gamma distributions, but it can be affected by the skewness of the data. While it provides an average value, in highly skewed distributions, it may not represent the typical data point accurately.
- Median: The median is a robust measure for gamma distributions, particularly when the distribution is highly skewed. It provides a central value that is less influenced by extreme values, offering a more representative central tendency for skewed data.
- Mode: For unimodal gamma distributions, the mode (the most frequent value) effectively identifies the peak of the distribution. In highly skewed distributions, the mode can highlight the most likely value, which is often more informative than the mean.
- Geometric Mean: The geometric mean can be relevant for gamma distributions when dealing with multiplicative processes. It emphasizes the central mass of the data, but like the arithmetic mean, it may not always provide an intuitive central value in skewed distributions.
- Harmonic Mean: The harmonic mean is generally not used for gamma distributions. It is more suited for datasets involving rates or ratios and may not offer a meaningful measure of central tendency for this type of data.
For a gamma distribution, the choice between the mean, median, and mode depends heavily on the degree of skewness. In moderately skewed distributions, the arithmetic mean can serve well, while in highly skewed distributions, the median provides a more accurate central tendency. The mode is particularly useful for identifying the most probable value in skewed distributions.
Other Metrics
Apart from the main measures of central tendency, there are other metrics that can be useful in specific situations. These metrics include the trimmed mean, winsorized mean, and weighted mean. While they may not be as commonly used as the primary measures, they offer additional tools for dealing with outliers and weighted data.
- Trimmed Mean: This is the mean calculated after removing a specified percentage of the smallest and largest values, which helps in reducing the effect of outliers.
- Winsorized Mean: Similar to the trimmed mean, but instead of removing outliers, extreme values are replaced with the nearest remaining values.
- Weighted Mean: This mean gives more importance to some values over others, making it useful when certain values in the dataset are more significant.
Conclusion
In summary, choosing the appropriate measure of central tendency is essential for accurate data analysis. Adhering to recognized standards and practices within the scientific community ensures that the selected metric aligns well with the specific characteristics of the dataset, whether it exhibits skewness, contains outliers, or conforms to a particular distribution.
Nevertheless, relying solely on measures of central tendency may not offer a comprehensive view of the data. Supplementary measures such as measures of variability are indispensable for capturing the complete spectrum and dispersion of data points, thereby enriching the overall understanding of the dataset.
When confronted with datasets that are challenging to characterize, advanced techniques beyond descriptive statistics can be employed. These methods not only modify and refine the original data but also enhance its suitability for analysis, prediction, and the development of robust algorithms.