by Nishanth Entoor
Share
by Nishanth Entoor

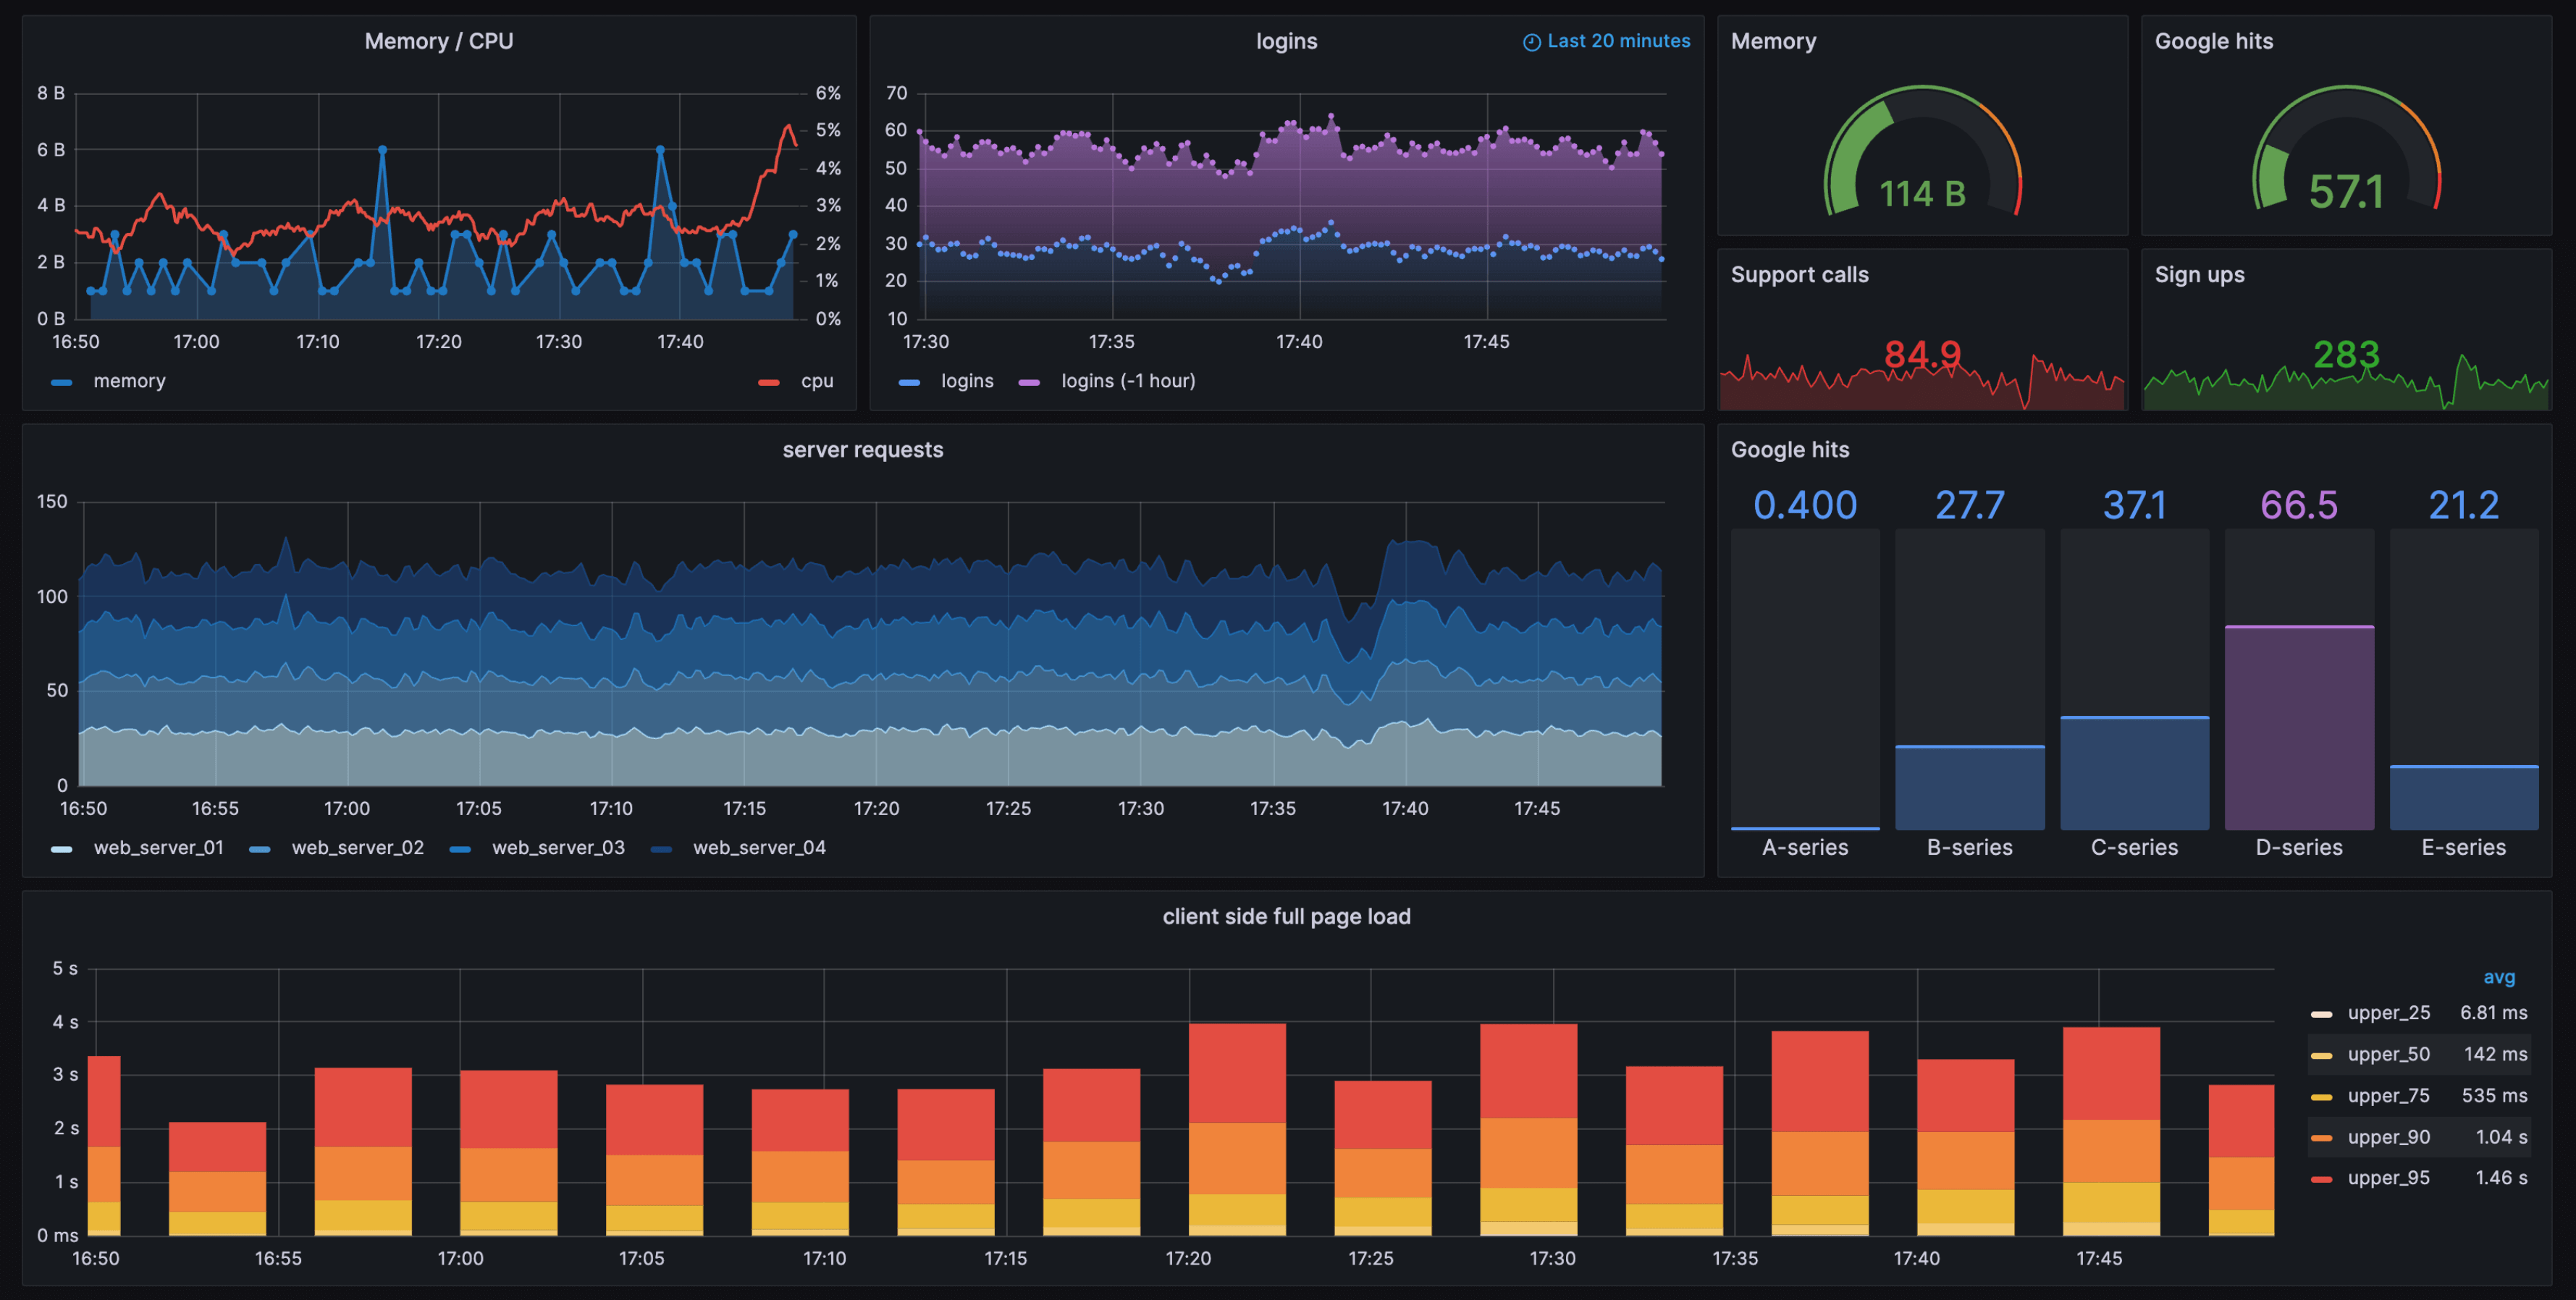
Last year we started a new project, we were tasked to build dashboards to showcase the Key Performance Indicators (KPIs) of our client’s data platform and various data sources. We were all excited to start this new project. Because who wouldn’t be excited to create awesome and geeky looking dashboards?
The tool for creating the dashboards had not yet been decided and we were asked to choose a suitable one by weighing in the benefits and shortcomings of the three popular open-source tools namely Apache Superset, Grafana, and Kibana.
The Comparison
Here is the summary of what these tools bring to the table:
| Apache Superset | Grafana | Kibana | |
|---|---|---|---|
| Focus | Designed with strong focus on business intelligence and suitable for data analysis, creating dashboards, and generating reports | Developed with primary focus on monitoring, observability, and time series data visualization | Developed as part of Elastic Stack with focus on log and event data analysis and visualization |
| Data Sources | Supports a variety of data sources with a great flexibility in connecting to various data platforms such as Snowflake, Amazon Redshift, Databricks, and others | Supports a wide variety of data sources which includes Prometheus, InfluxDB, Graphite, MySQL, and others | Primarily used only with Elasticsearch |
| Alerting | Alerting capabilities are not mature | Robust alerting features | Limited native alerting capabilities |
| Costumization | Provides high level customization and extensibility for creating custom charts and dashboards using Python libraries | Extensive customization possibilities with rich ecosystem of plugins and community-contributed dashboards | Customization options are more focused on log and event data visualization |
| Community Support | Has an active community but still growing | Has a large and active community with a significant community support | Community support is limited compared to Grafana |
The Initial Investigation
We first started comparing Apache Superset and Grafana which happened to be our natural choices due to their popularity in dashboarding and visualization space, their ability to connect to a plethora of data sources and of course our prior encounters with these tools.
Though these two tools are great for data visualization and analytics, they have their own strengths and we had to figure out which tool suits our use case.
Upon investigating these two tools, we found that Grafana would be an appropriate option for our use case as we were interested in visualizing time-series data and aggregated metrics and not in the business intelligence capabilities which is Apache Superset’s strong suit. Having to implement an alerting system in the future in addition to dashboarding, Grafana’s robust alerting features as well contributed to choosing Grafana over Apache Superset.
It was almost confirmed that we will go with Grafana.
The Subsequent Investigation
Though Kibana was initially not considered as one of the possibilities, it later became one, as it was already being used in the project and to see if we can leverage it instead of introducing a new tool.
We engaged Kibana and started comparing the differences between Grafana and Kibana. Even after a thorough investigation, subconsciously leaning towards Kibana, we found Kibana would not be a great fit for time series data and metrics visualization due its limitations with respect to customization and data aggregation, especially when we have Grafana which is perceived as the de facto visualization tool for time series data and metrics visualization. Not to mention having to work only with Elasticsearch instead of using a dedicated time series database or any relational database and losing the ability to write queries in a familiar SQL or SQL-like language.
The Ultimate Trade-Off
Though all our investigation pointed us towards Grafana, we were made to go with Kibana as it was already being used widely in the project for log monitoring/analysis and to leverage it instead of bringing in a new tool.
The Review
We did manage to create the dashboards with time series data and metrics visualization pretty much seamlessly except for some complexities in a few places with customization using Vega and Painless script for data aggregation.
Although it did not turn out to be a huge pain point, using Painless script for data aggregation was a bit complex and not as dynamic/flexible as it would have been if we had used Grafana with SQL or SQL-like languages to query a time series or relational database.
But to answer the most important question, was the ultimate compromise worth it? Absolutely.
The decision to use Kibana proved to be crucial in accelerating the development process and helping us achieve desired results earlier than we expected since we used a tool that the team is already familiar with, the head start we got in terms of choosing the tool that is already deployed and fully functional, and eliminating the need to spend additional efforts to deploy and integrate a new tool into the existing architecture. Let’s not forget the reduction in the maintenance efforts from not bringing in a new tool.
The Takeaways
- Firstly, Kibana proved to be a tool that is not just meant for log/event monitoring/analysis but also a viable option for time series data and metric visualizations even though we might have to choose Grafana for more complex and custom solutions.
- Secondly, the key takeaway would be that we need to choose a solution that is more suitable to us by also evaluating the impact it would create on the whole system instead of just choosing the most sophisticated tool or the tool with “cool” features irrespective of whether we need them or not. There is more to consider such as initial cost, future maintenance, resource training, and so on than just features.
The Fun Fact
Creating all those fancy dashboard was not just some drag and drop or writing simple scripts. It was much more complicated than we as backend developers anticipated ?


